Checking H-1B Claims
The H-1B visa program has recently become a hot button topic. President Trump’s administration have made allegations that the program has been abused to replace American workers with cheap labor. One claim the administration specifically made is “that about 80 percent of H1B workers are paid less than the median wage in their fields”.
The result of that is that workers are often brought in well below market rates to replace American workers Source
Nasscom, an Indian IT lobby, responded to accusations by stating that the workers exported are highly skilled and that it is to meet a shortage in skills in the United States.
Given that the issue has become a political topic with contradicting assertions on both sides, I wanted to take a look at the available data and try to make some conclusions for myself.
Methods
The data used for this comes from the US Department of Labor’s disclosure on the LCA program here.
The LCA is a document employers are required to fill out and get approved before they can file for an H-1B visa. The purpose is to protect workers from being taken advantage of and to protect American wages.
Because the US DOL does not publish the H-1B data directly, the LCA’s are used as a proxy to determine applications for the H-1B visas. The method rests on the assumption that employers filing an LCA will likely proceed to file for an H-1B visa.
In addition, only LCA applications submitted in February and March are used. This is because H-1B applications have historically opened in early April. These two months are close enough to it that I believe there is a high correlation of the LCA applications submitted in this time period being submitted to H-1B. The anomalous submissions for these two months somewhat support this.
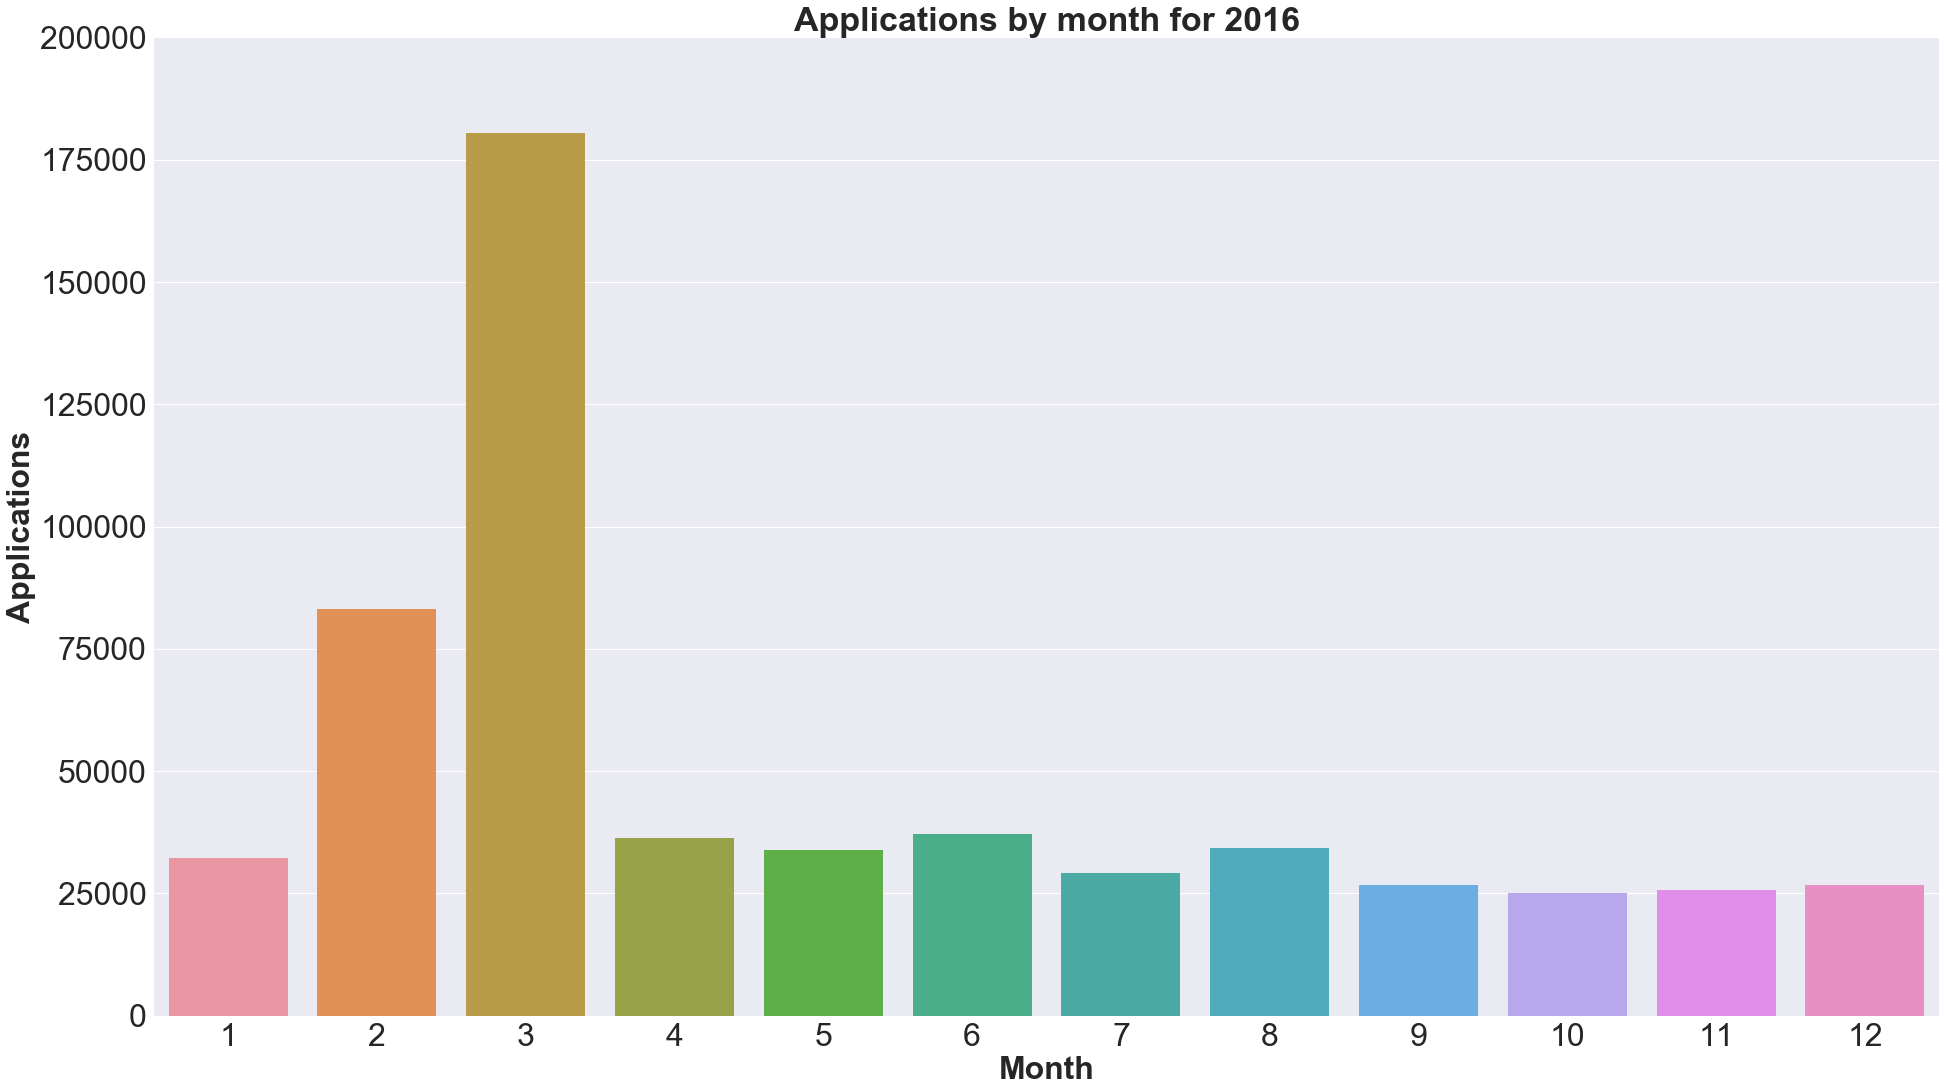
Submissions spike in February and March
Some back of the envelope calculations also seem to give decent numbers.
TODO
Granted, this is still not conclusive. but at the very least the general trends and compositions should be the same.
As a quick aside, I initially planned to use data graciously published by a user off Kaggle here. Unfortunately some of the information I wanted were removed in the sanitizing process.
As a result I proceeded to cleanse the data myself. The process for that is published in this post.
TODO
General Trends in H-1B applications
Applications increased 5 fold from 2010 - 2017
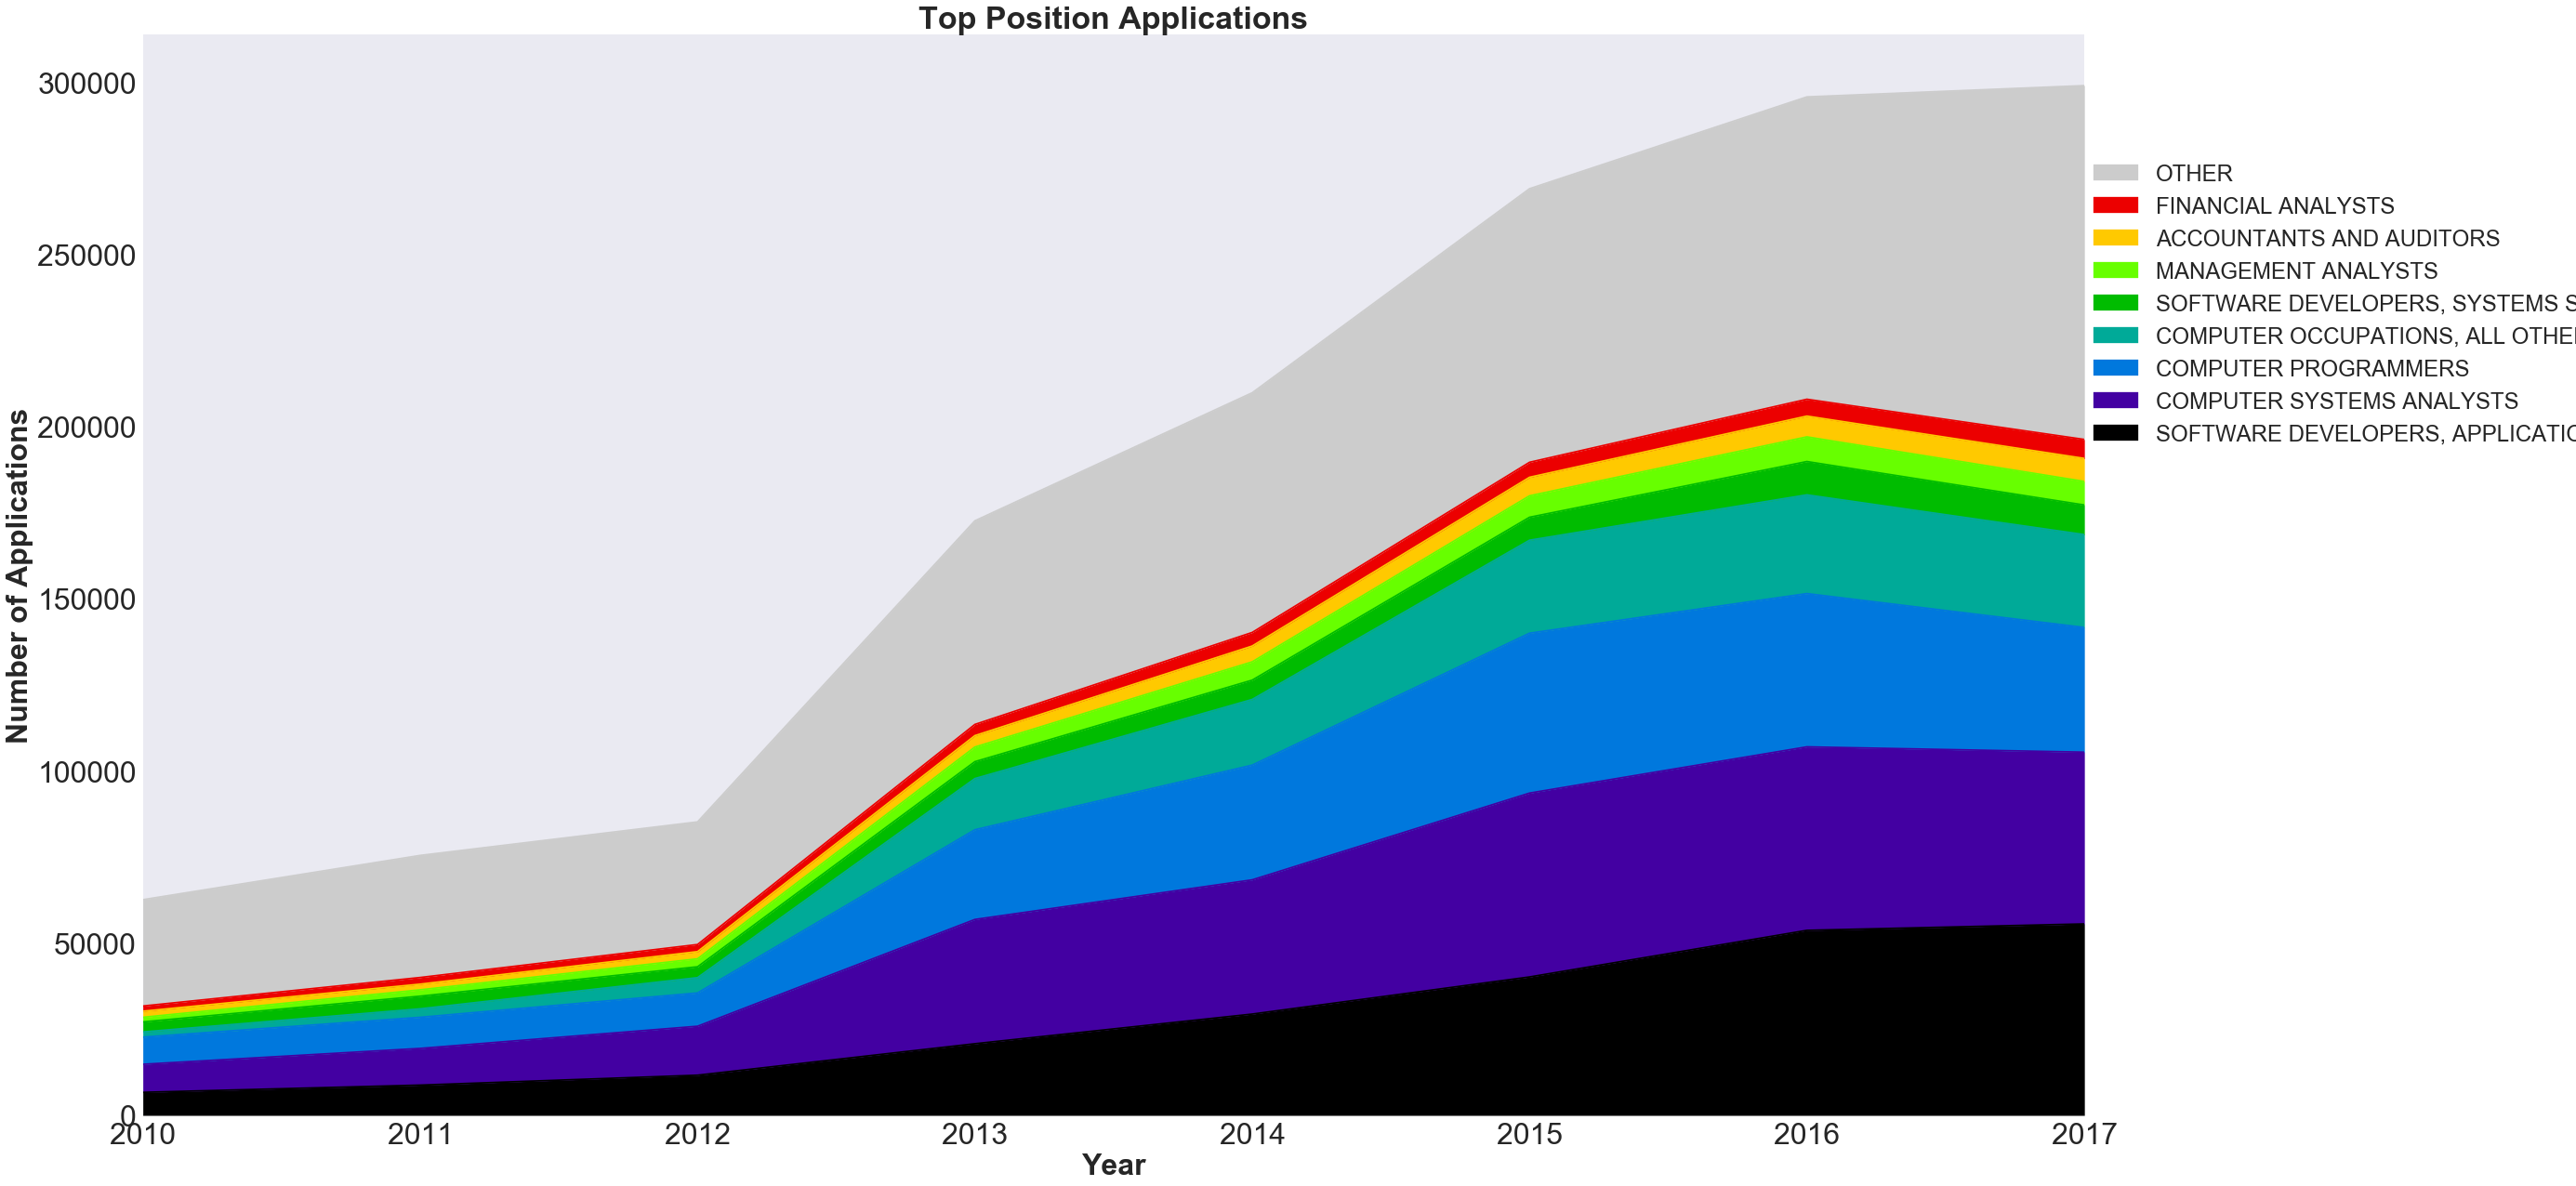
Between 2010 and 2017, the number of applications grew from an estimated 60,000 applications to 300,000. The bulk of this growth started in 2012 and continued up to 2016.
There was little to no growth from 2016-2017
The number of applications went from around 295,000 to 300,000 (within the margin of error).
Computer / software related professions are hot
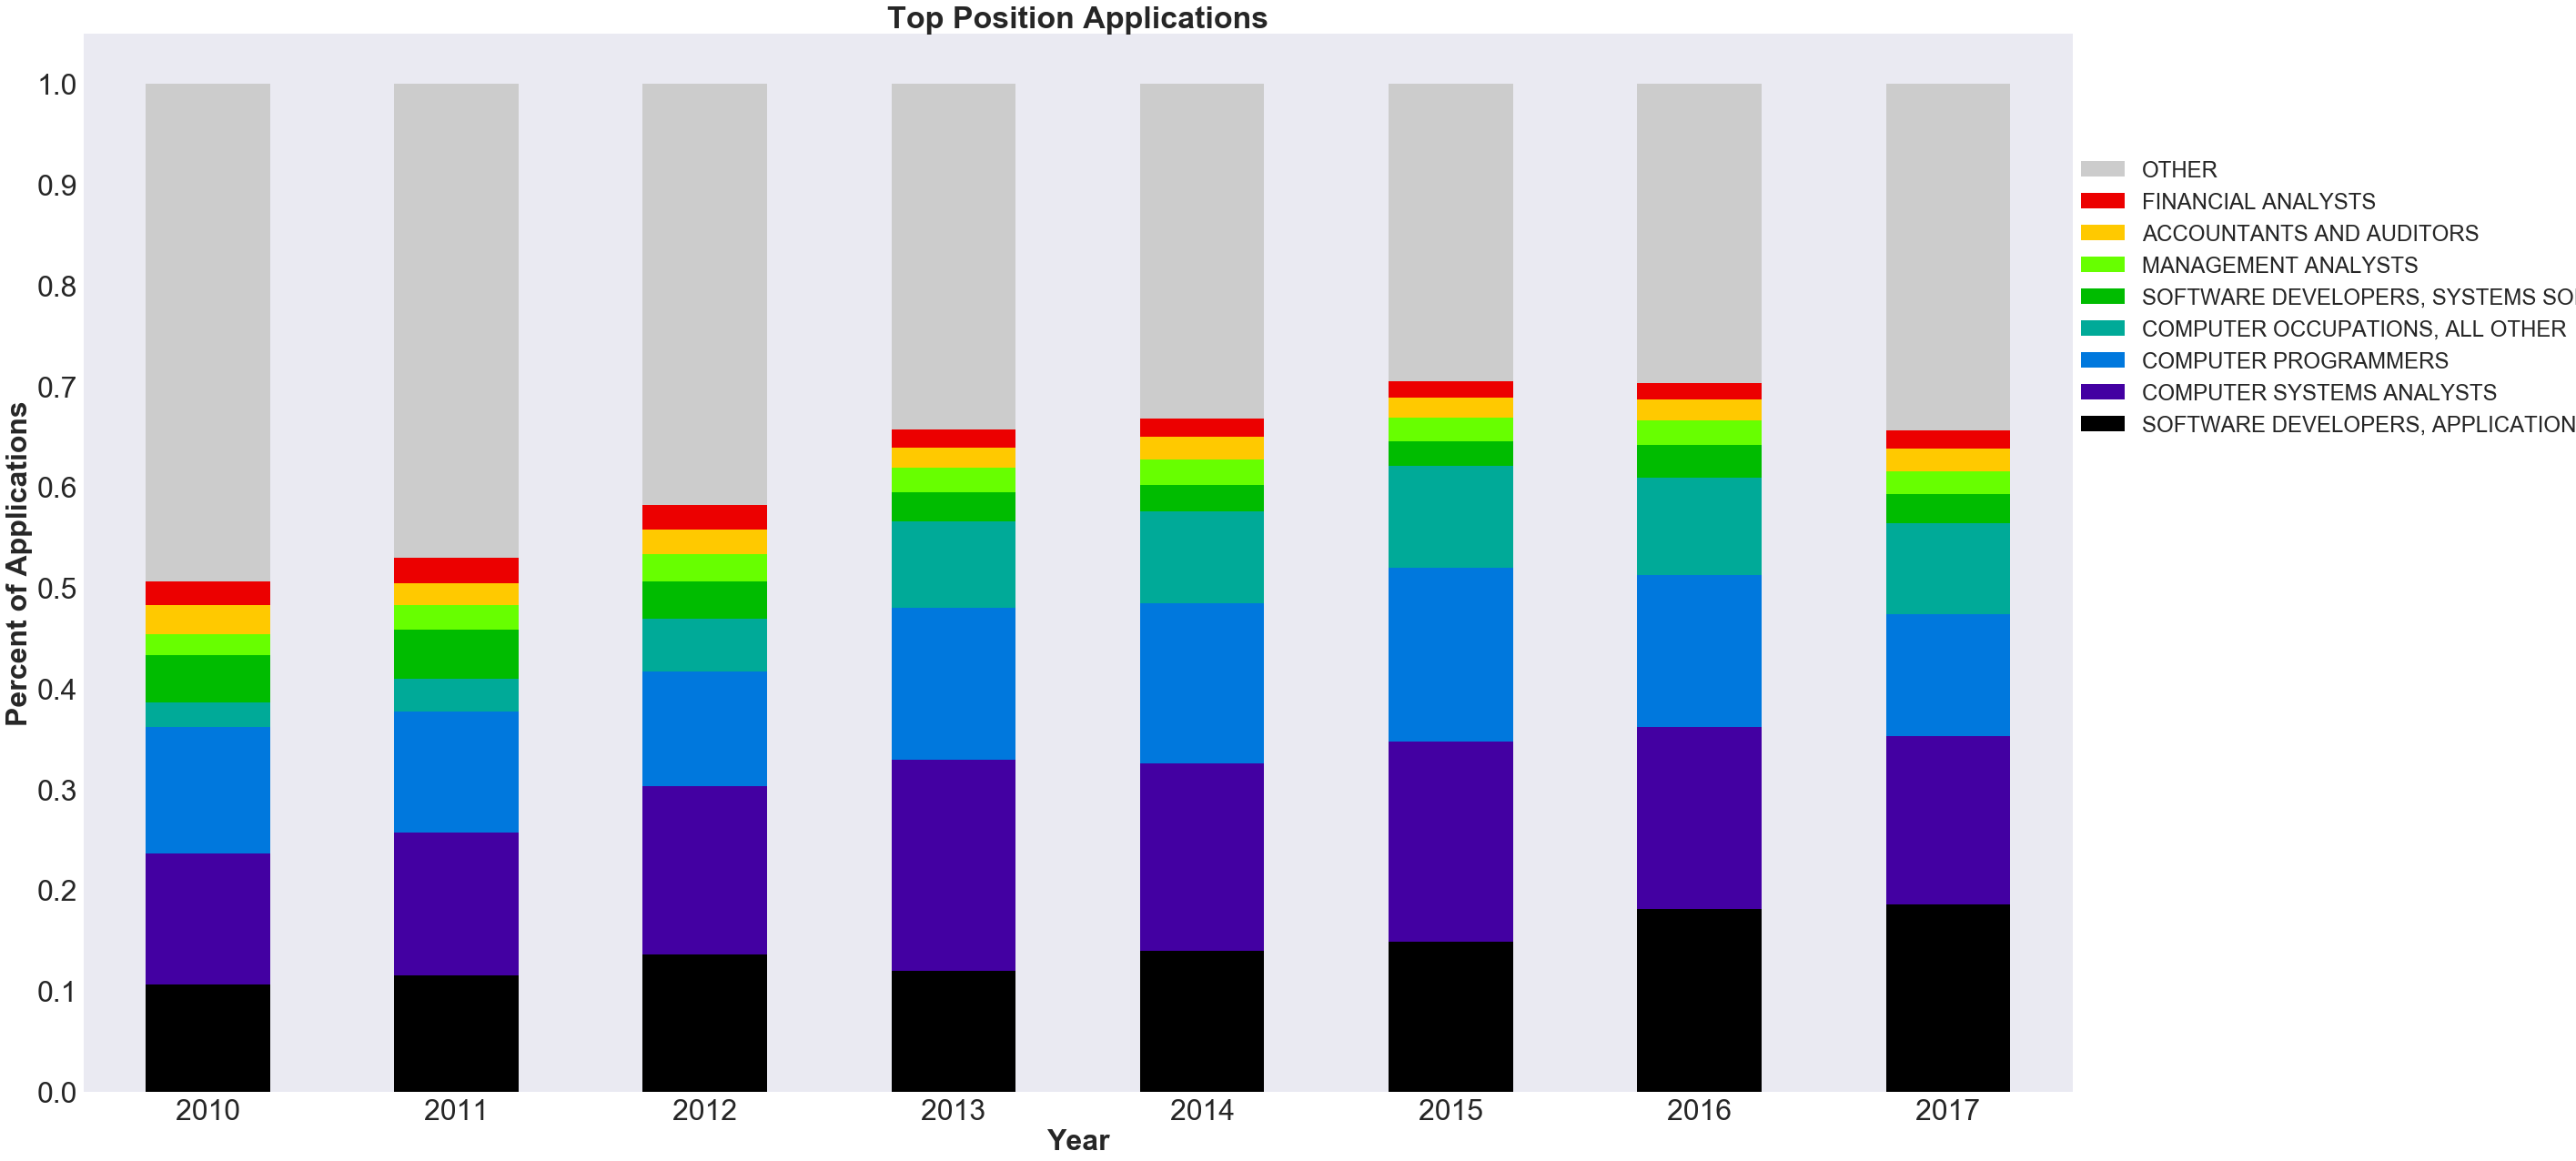
The top 8 applied for positions as defined by the US government’s SOC system, computer and software positions make up at least 175,000 applications for 2017. This makes up at least 60% of all applications.
There was a general decrease in the computer and mathematical sector
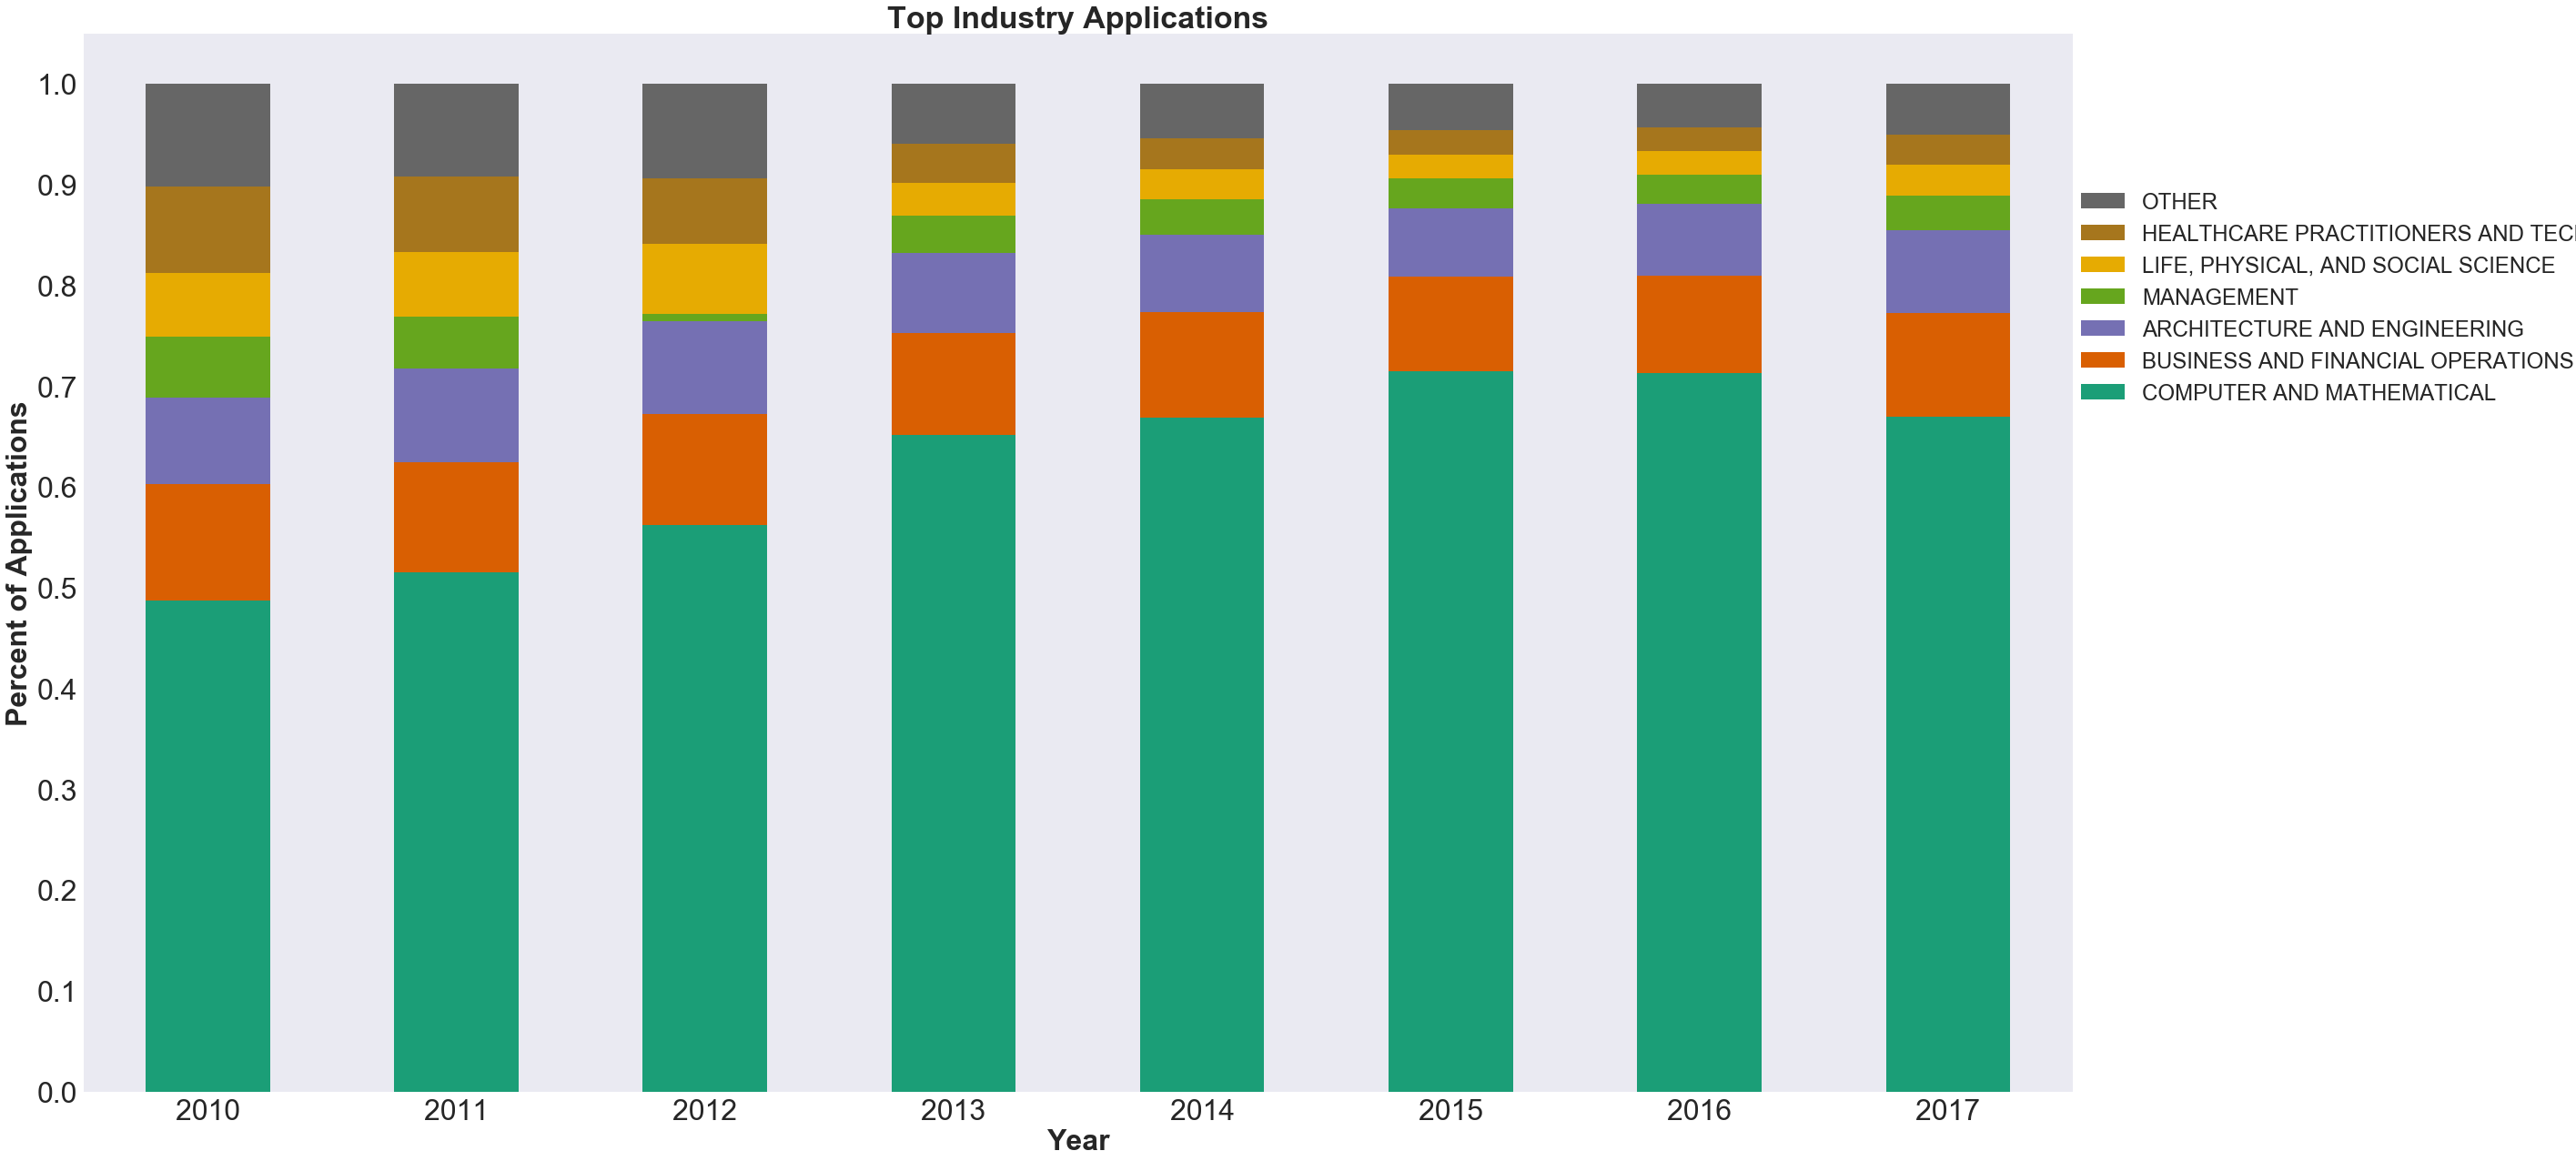
The net number of H1B applications from this industry (using SOC classification) group dropped about 10,000 from the previous year. As a whole the number of applications dropped from around 71% of all applications to 67%.
Trends in major applicants
The White House recently made accusations that some companies are abusing the H-1B system by flooding the system with applications to get a disproportionate amount of visas. In addition to this claim, it is alleged that the workers are “actually less skilled and lower paid than the workers that they’re replacing”.
Some companies specifically named were “Tata, Infosys, Cognizant”. Despite not naming India specifically, there seemed to have been enough innuendo such that Nasscom, an Indian IT lobby, responded to accusations by stating that the workers exported are highly skilled and that the numbers merely fulfill a shortage in the United States.
Nasscom has continued to defend Indian workers multiple other times.
“Only six Indian IT firms were among the top 20 recipients of the H-1B visas in fiscal 2015”
(IGATE TECHNOLOGIES INC., INTEL CORPORATION , IBM CORPORATION, AMAZON CORPORATE LLC, DELOITTE & TOUCHE LLP are respectively omitted below)
| COMPANY (2015) | APPLICATIONS | MEDIAN WAGE (ADJUSTED) |
|---|---|---|
| 1. INFOSYS LIMITED | 18204 | $73368 |
| 2. TATA CONSULTANCY SERVICES LIMITED | 8025 | $69865 |
| 3. ACCENTURE LLP | 5351 | $76846 |
| 4. IBM INDIA PRIVATE LIMITED | 5169 | $76006 |
| 5. WIPRO LIMITED | 4471 | $69033 |
| 6. DELOITTE CONSULTING LLP | 3130 | $82559 |
| 7. HCL AMERICA, INC. | 2936 | $73497 |
| 8. IGATE TECHNOLOGIES INC. | 2545 | $67905 |
| 9. TECH MAHINDRA (AMERICAS),INC. | 2317 | $73669 |
| 10. LARSEN & TOUBRO INFOTECH LIMITED | 1714 | $72018 |
| 11. ERNST & YOUNG U.S. LLP | 1649 | $79669 |
| 12. MICROSOFT CORPORATION | 1531 | $122562 |
| 13. GOOGLE INC. | 1467 | $123838 |
| 14. UST GLOBAL INC | 1164 | $61919 |
| 15. COGNIZANT TECHNOLOGY SOLUTIONS U.S. CORPORATION | 1035 | $68023 |
| ….. | …. | …… |
| 20. AMAZON CORPORATE LLC | 662 | $113518 |
Looking at the top 20 applicants, we can see that the data supports Nasscom’s claim. Namely these companies would be Infosys, Tata, IBM India, Wipro, Larsen & Toubro, and Cognizant.
Something to note is that the range for these 6 companies actually fall within the top 15, which increases the relative weight. In addition, if we also include companies that are merely American based subsidiaries but India headquartered, this would include HCL America and Tech Mahindra.
This means that at least 8 of the top 15 H-1B applicants for 2015 are either India based or have a parent company which is India based.
This trend also holds over the entire 2010 - 2017 period.
| COMPANY (2010-2017) | APPLICATIONS | MEDIAN WAGE (ADJUSTED) |
|---|---|---|
| 1. INFOSYS LIMITED | 73770 | $75094 |
| 2. TATA CONSULTANCY SERVICES LIMITED | 29429 | $68730 |
| 3. ACCENTURE LLP | 19478 | $76287 |
| 4. WIPRO LIMITED | 18951 | $70385 |
| 5. DELOITTE CONSULTING LLP | 17526 | $84743 |
| 6. TECH MAHINDRA (AMERICAS),INC. | 16167 | $72890 |
| 7. IBM INDIA PRIVATE LIMITED | 15220 | $76189 |
| 8. HCL AMERICA, INC. | 11300 | $73649 |
| 9. CAPGEMINI AMERICA INC | 10993 | $74400 |
| 10. MICROSOFT CORPORATION | 9995 | $118232 |
| 11. ERNST & YOUNG U.S. LLP | 9948 | $80495 |
| 12. GOOGLE INC. | 8968 | $126000 |
| 13. LARSEN & TOUBRO INFOTECH LIMITED | 7342 | $68469 |
| 14. COGNIZANT TECHNOLOGY SOLUTIONS U.S. CORPORATION | 7337 | $69722 |
| ….. | …. | …… |
| 20. UST GLOBAL INC | 3852 | $63028 |
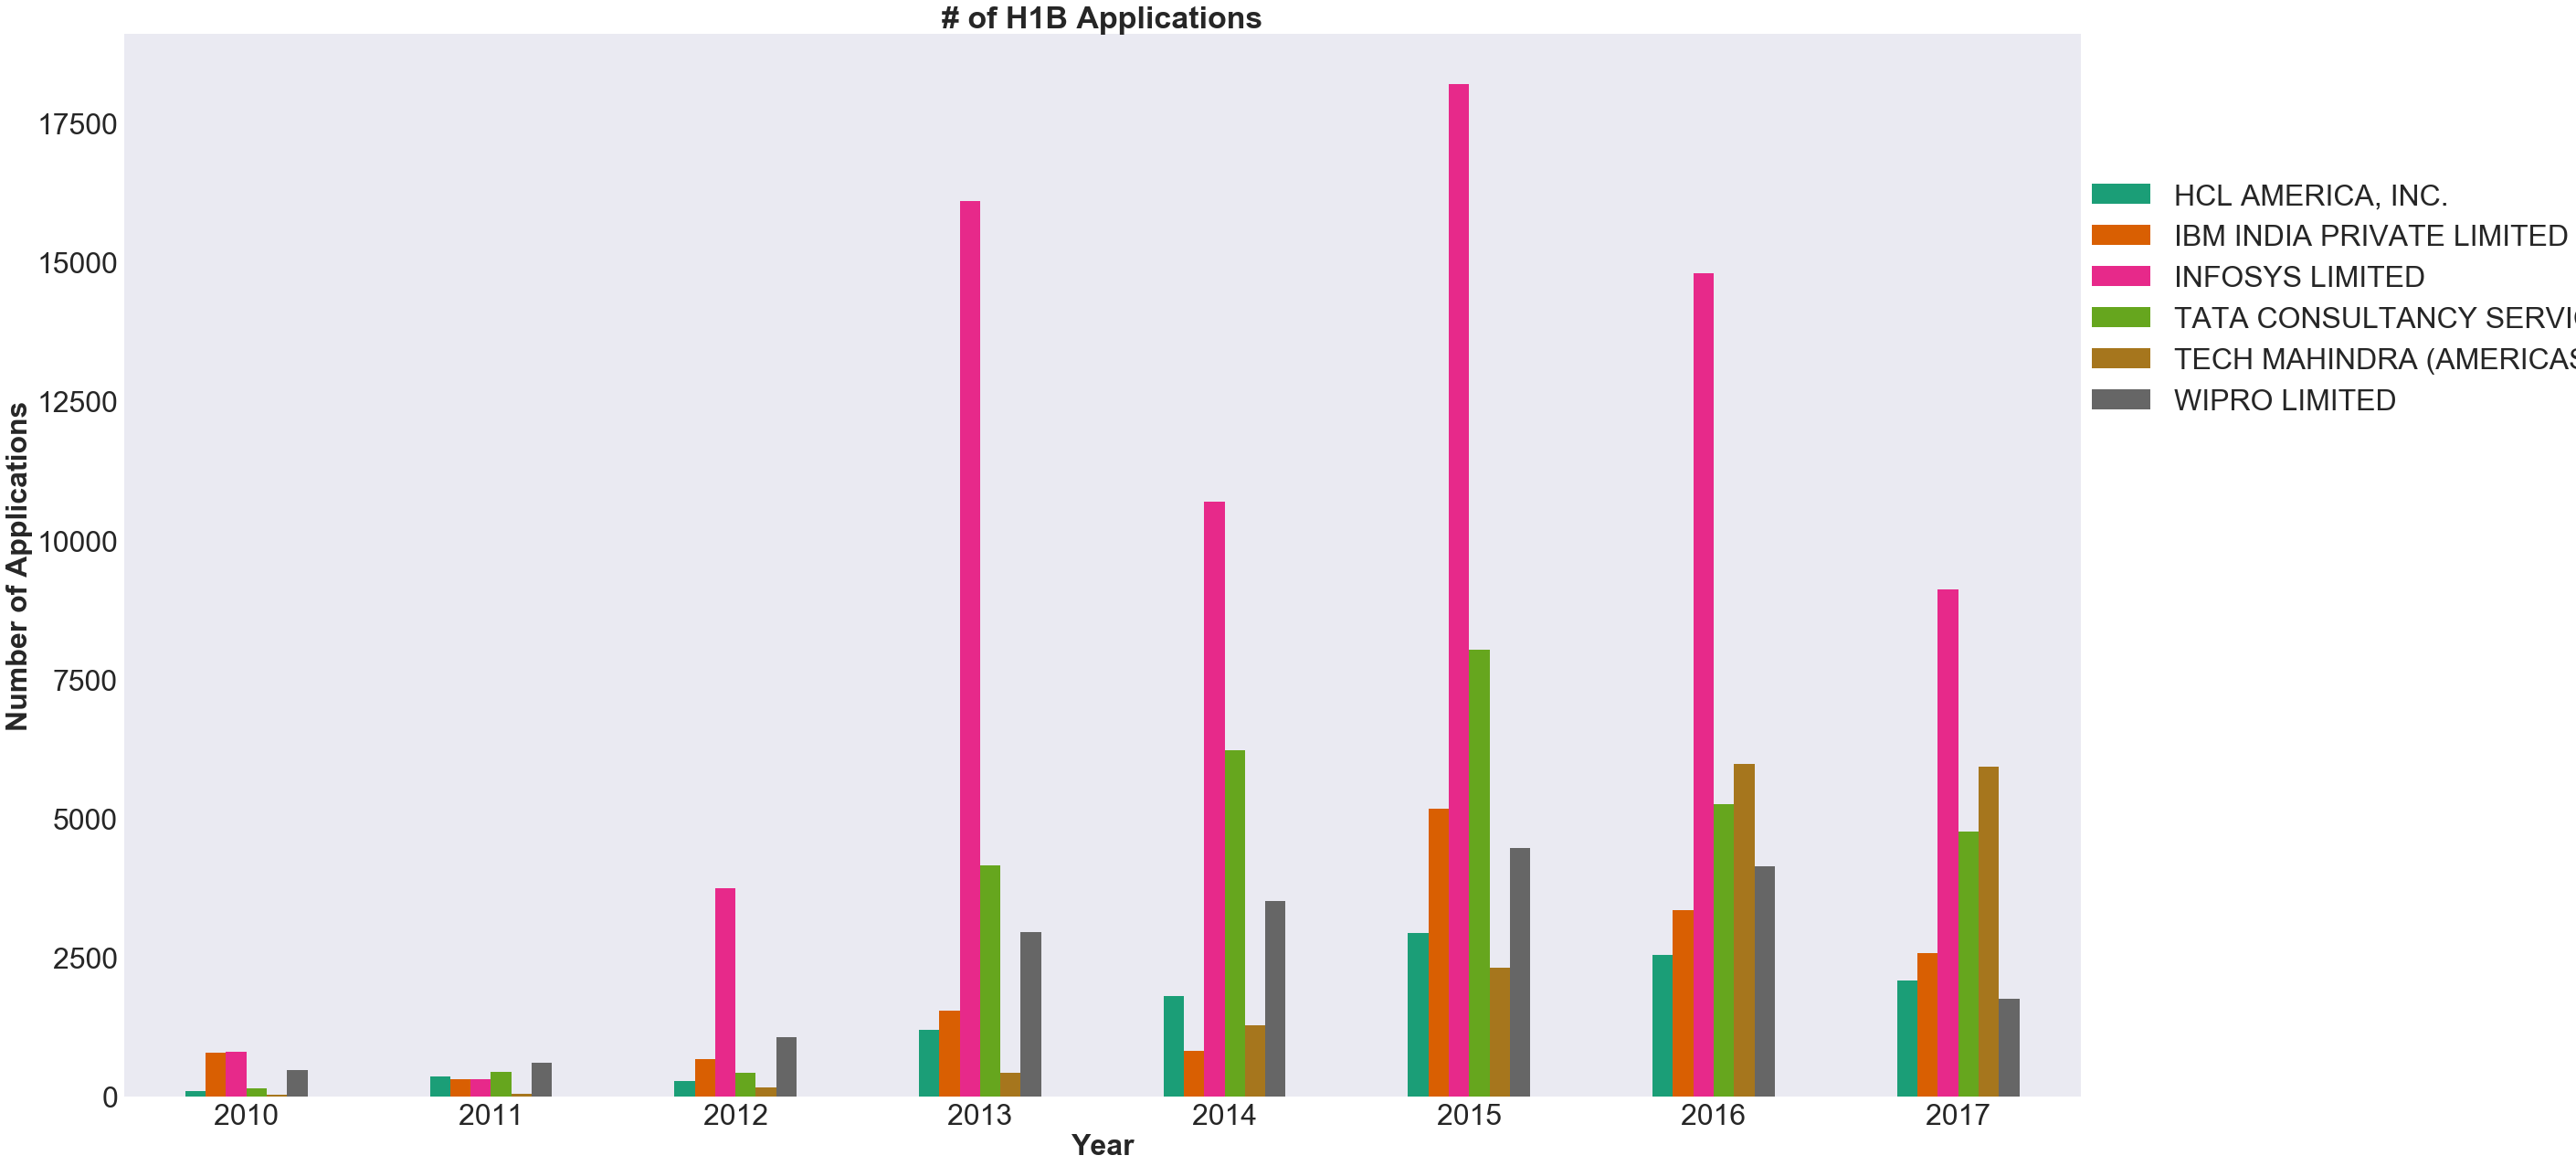
Top Indian IT firm applications peaked in 2015
The top 10 indian applicants reached a peak back in 2015 and as a net have decreased tremendously in the past 2 years. Infosys is perhaps the most dramatic, dropping from a high of ~18,000 applications in 2015 to ~9,000 in 2017.
Trends in wages
One of the accusations by the White House has been that the workers brought in by the supposed H-1B abusers are a form of cheap labor.
To check on these claims, the median wages for the top 5 positions brought over by each of the top 6 Indian IT firms was calculated. In order to take geography into account, the wages were were calculated for each city.
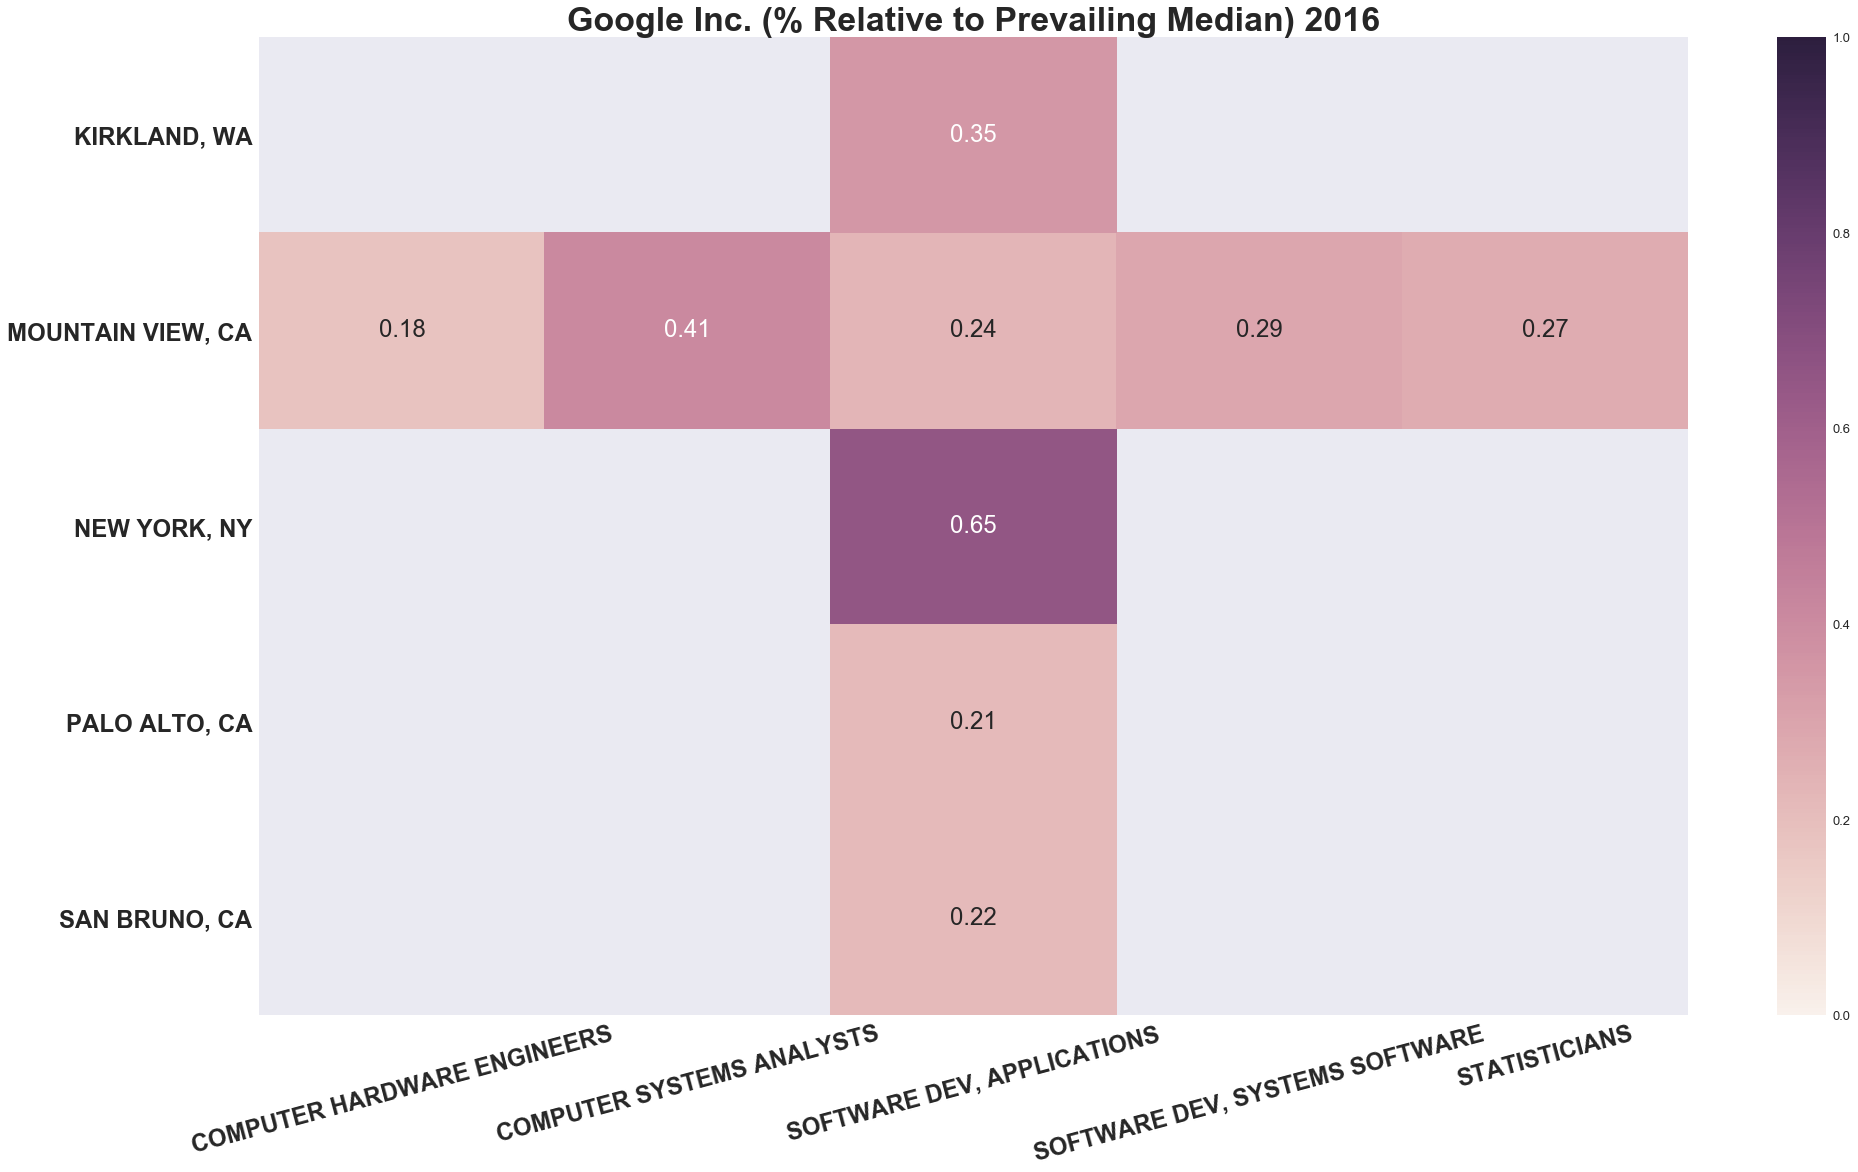
The heatmaps below show the workers’ wages for the top 5 positions in the top 5 worksite cities for each company. To reduce variance, values are shown only if there are at least 10 such workers at each worksite.
The percentage of the workers’ wage vs the market wage in the same geo is also shown. The values for this are calculate using the workers’ wage and prevailing wage filed by employers.
Exemplary heatmaps are chosen below to save space. A full gallery for all the companies can be found here.
TODO
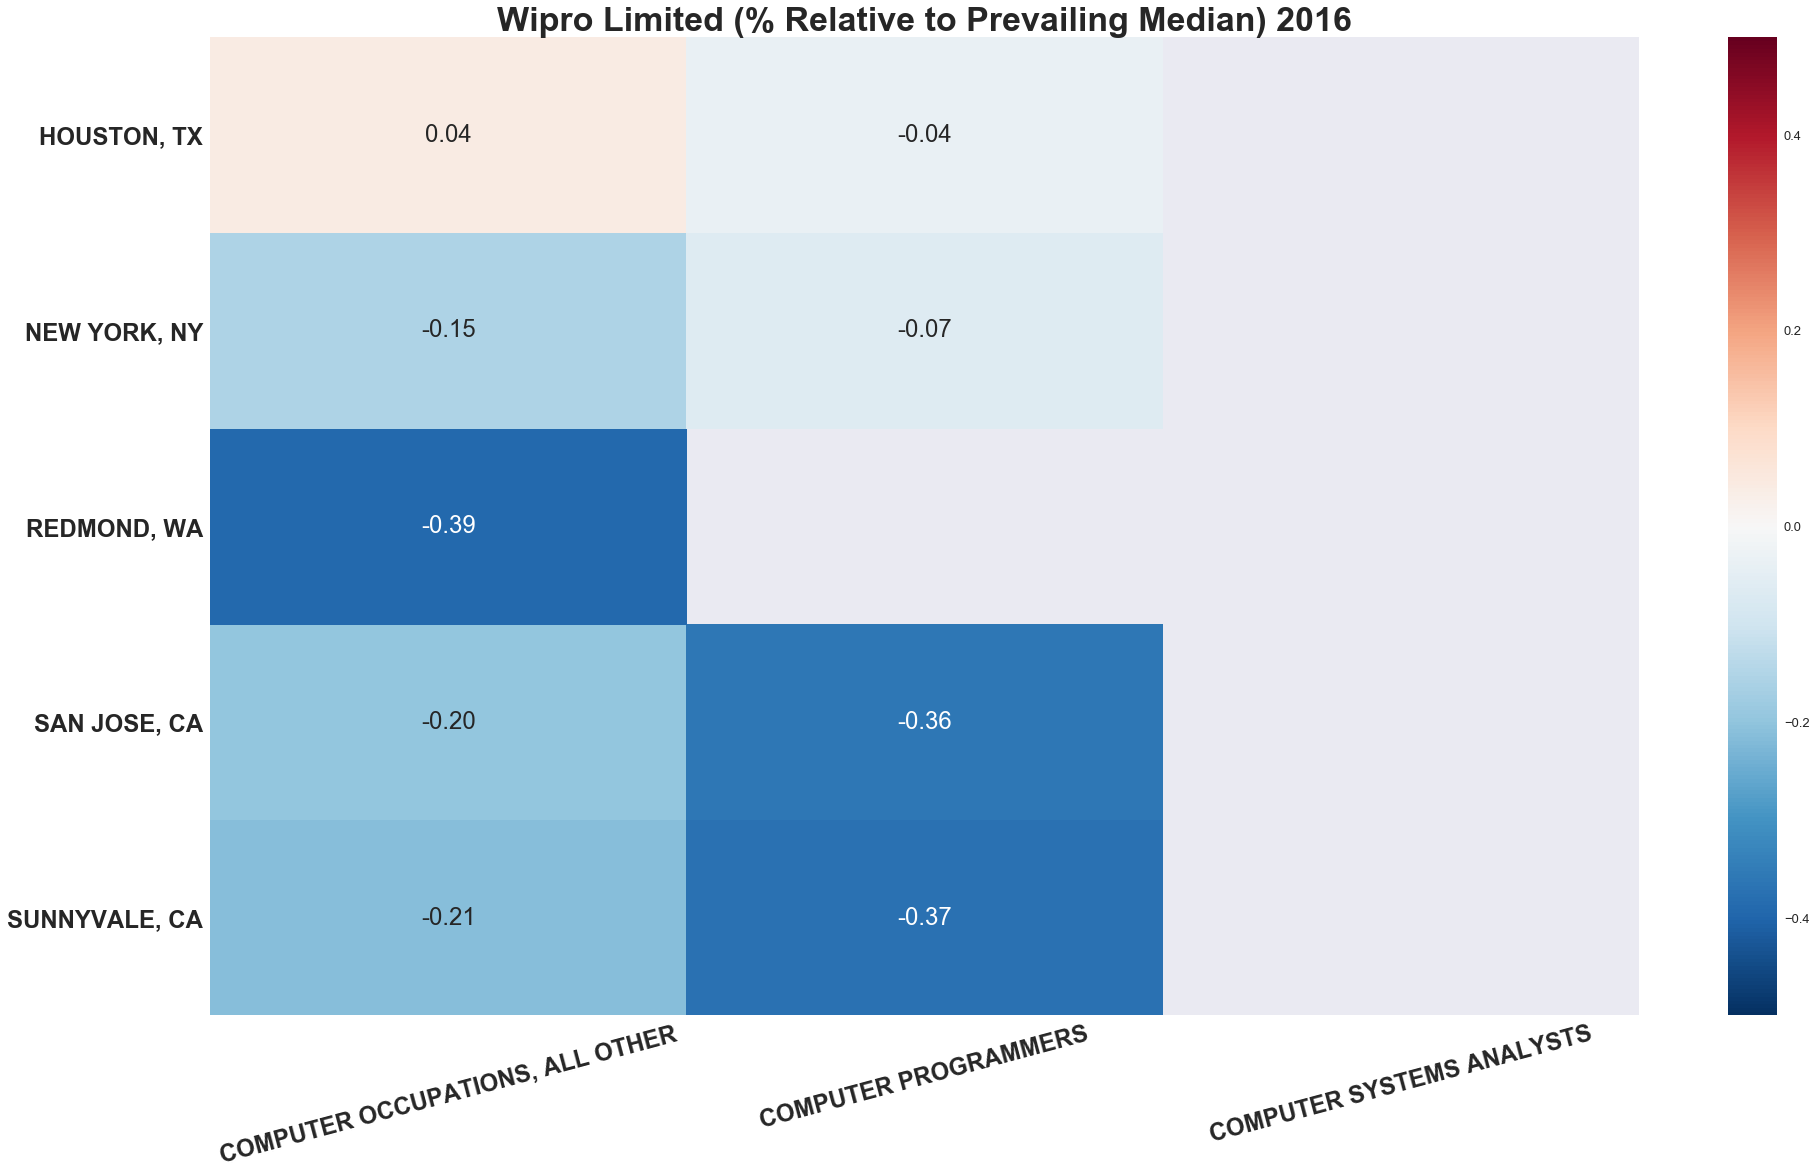
Top Indian IT Firm Workers Are Spread Out
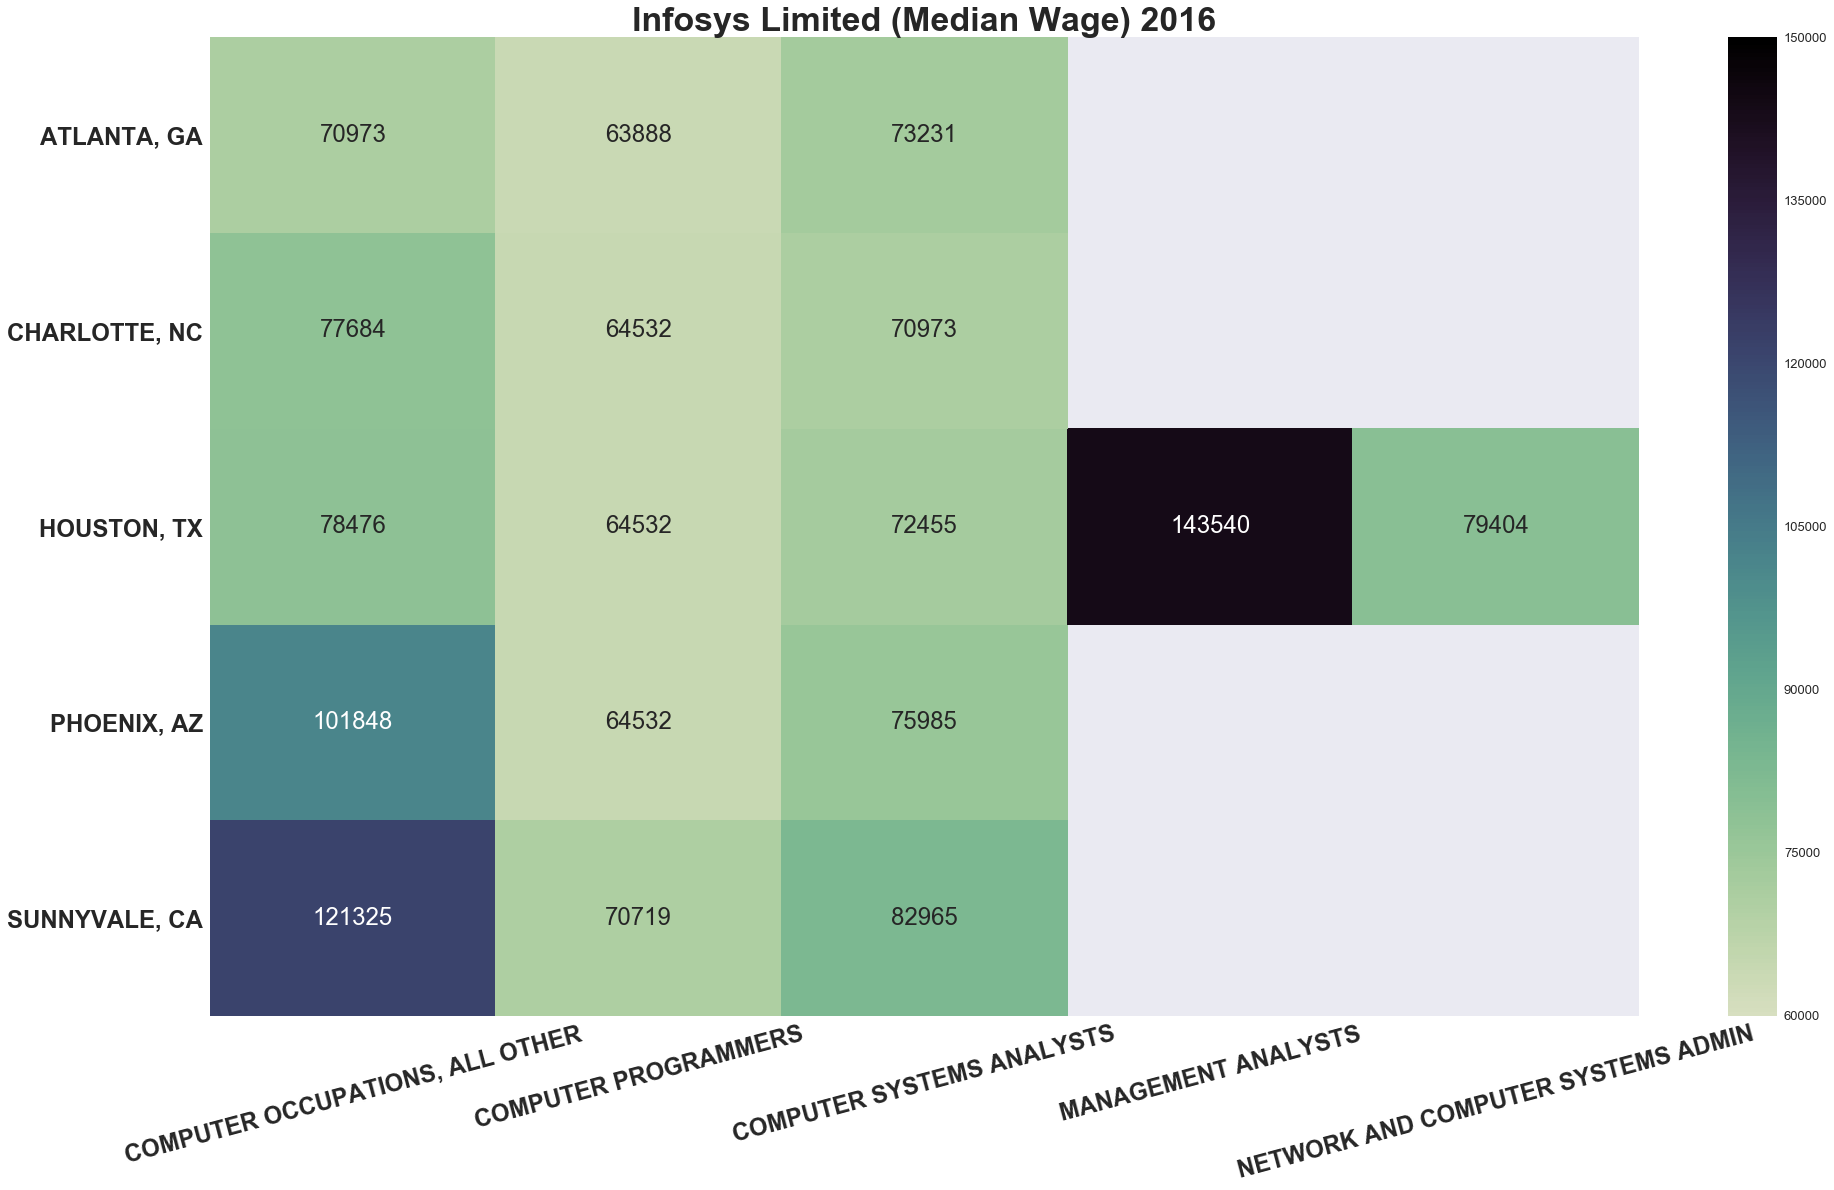
Unlike some of the major tech names such as Google, Microsoft, etc. the majority of Indian IT firms spread workers out all over the US rather than just a few central metropolitan areas.
Top Indian IT Firm Workers Are Paid Above the Market Wage
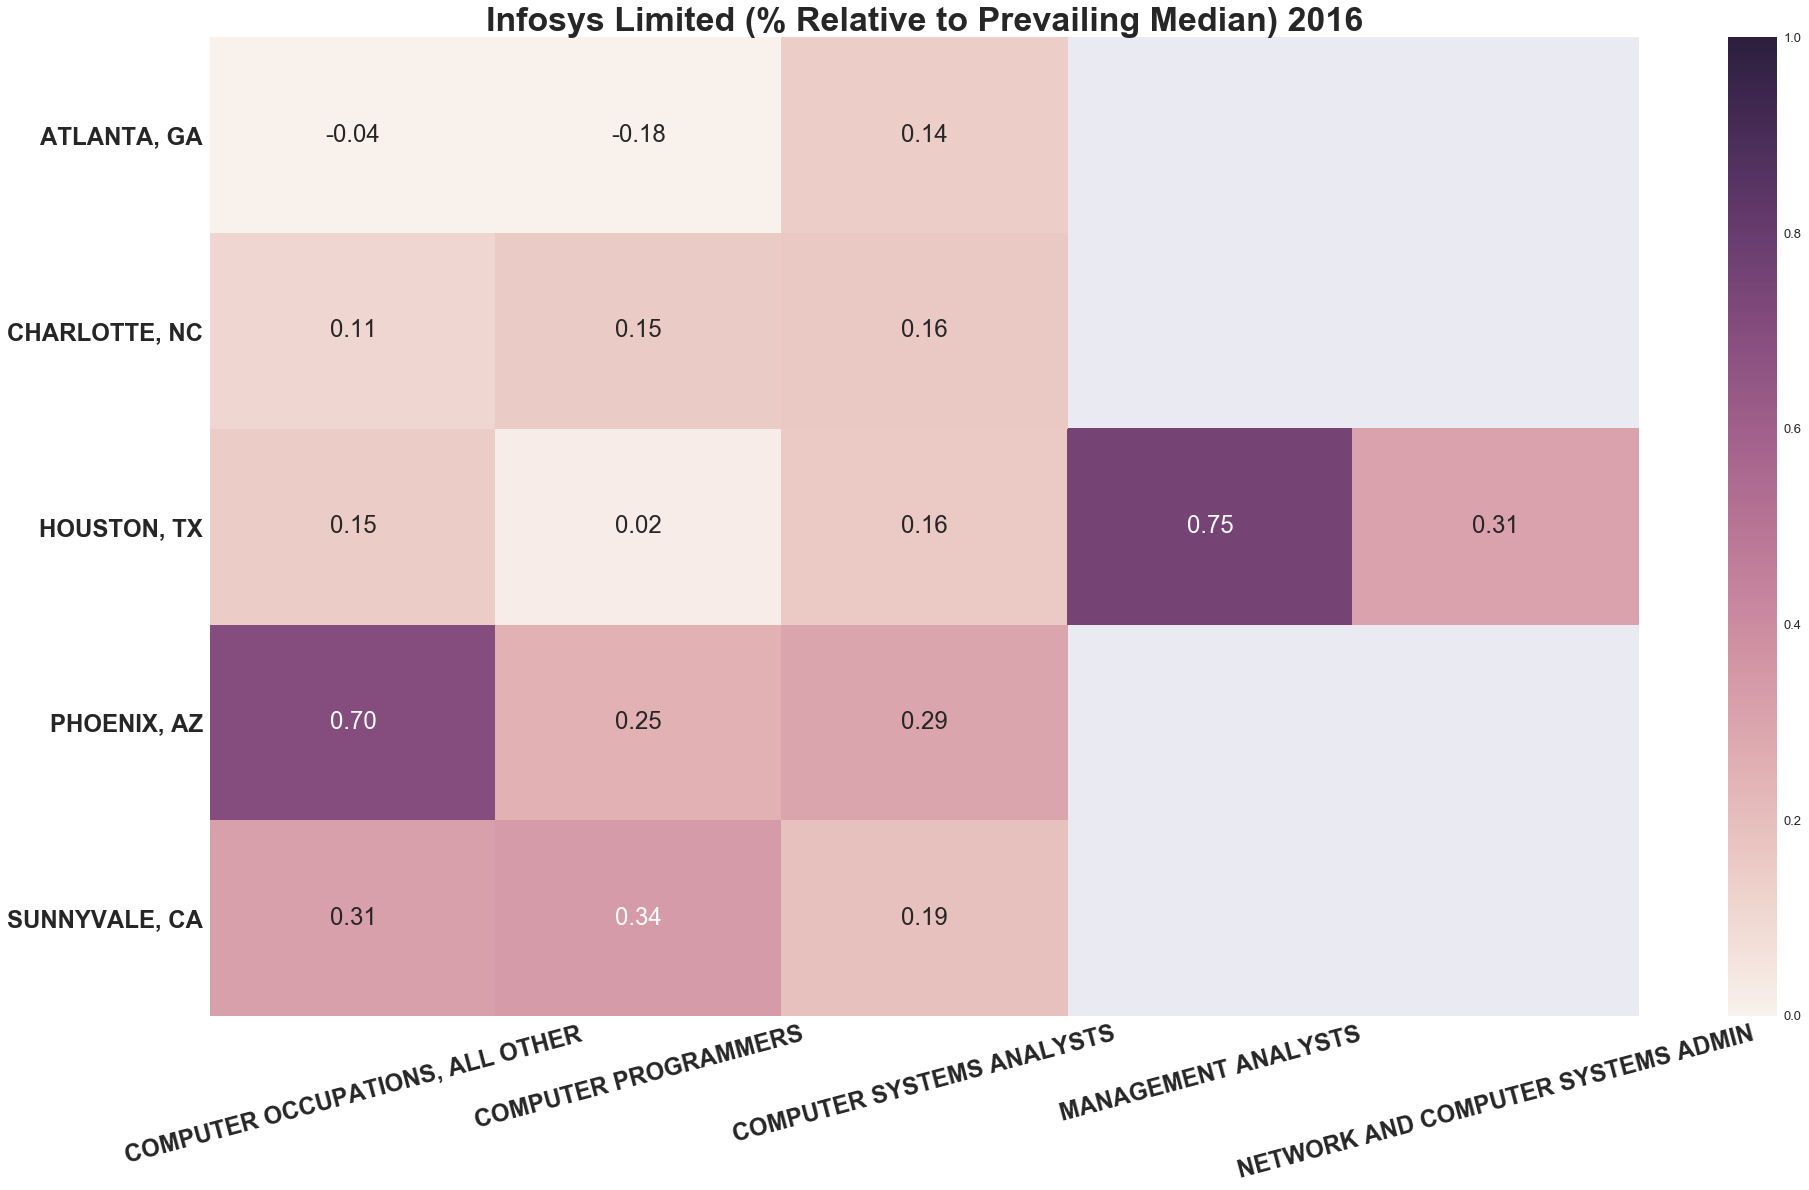
In regards to the market wage provided by H-1B employers, the workers brought in by the top Indian IT firms are paid mostly above the market.
But Not So Fast. Questions On The Wages.
Using the numbers provided by H-1B employers, the workers brought in to the US seem to not be cheap labor being paid under market wages.
However, during this process, I ran across something strange. When we compare the wage maps between the Indian IT firms and major household-name American firms such as Google, Microsoft, etc. we see an extremely contrasted picture.
(As above, a full gallery can be found here)
Why Do Top Indian IT Firms Pay So Much Below Top American Firms?
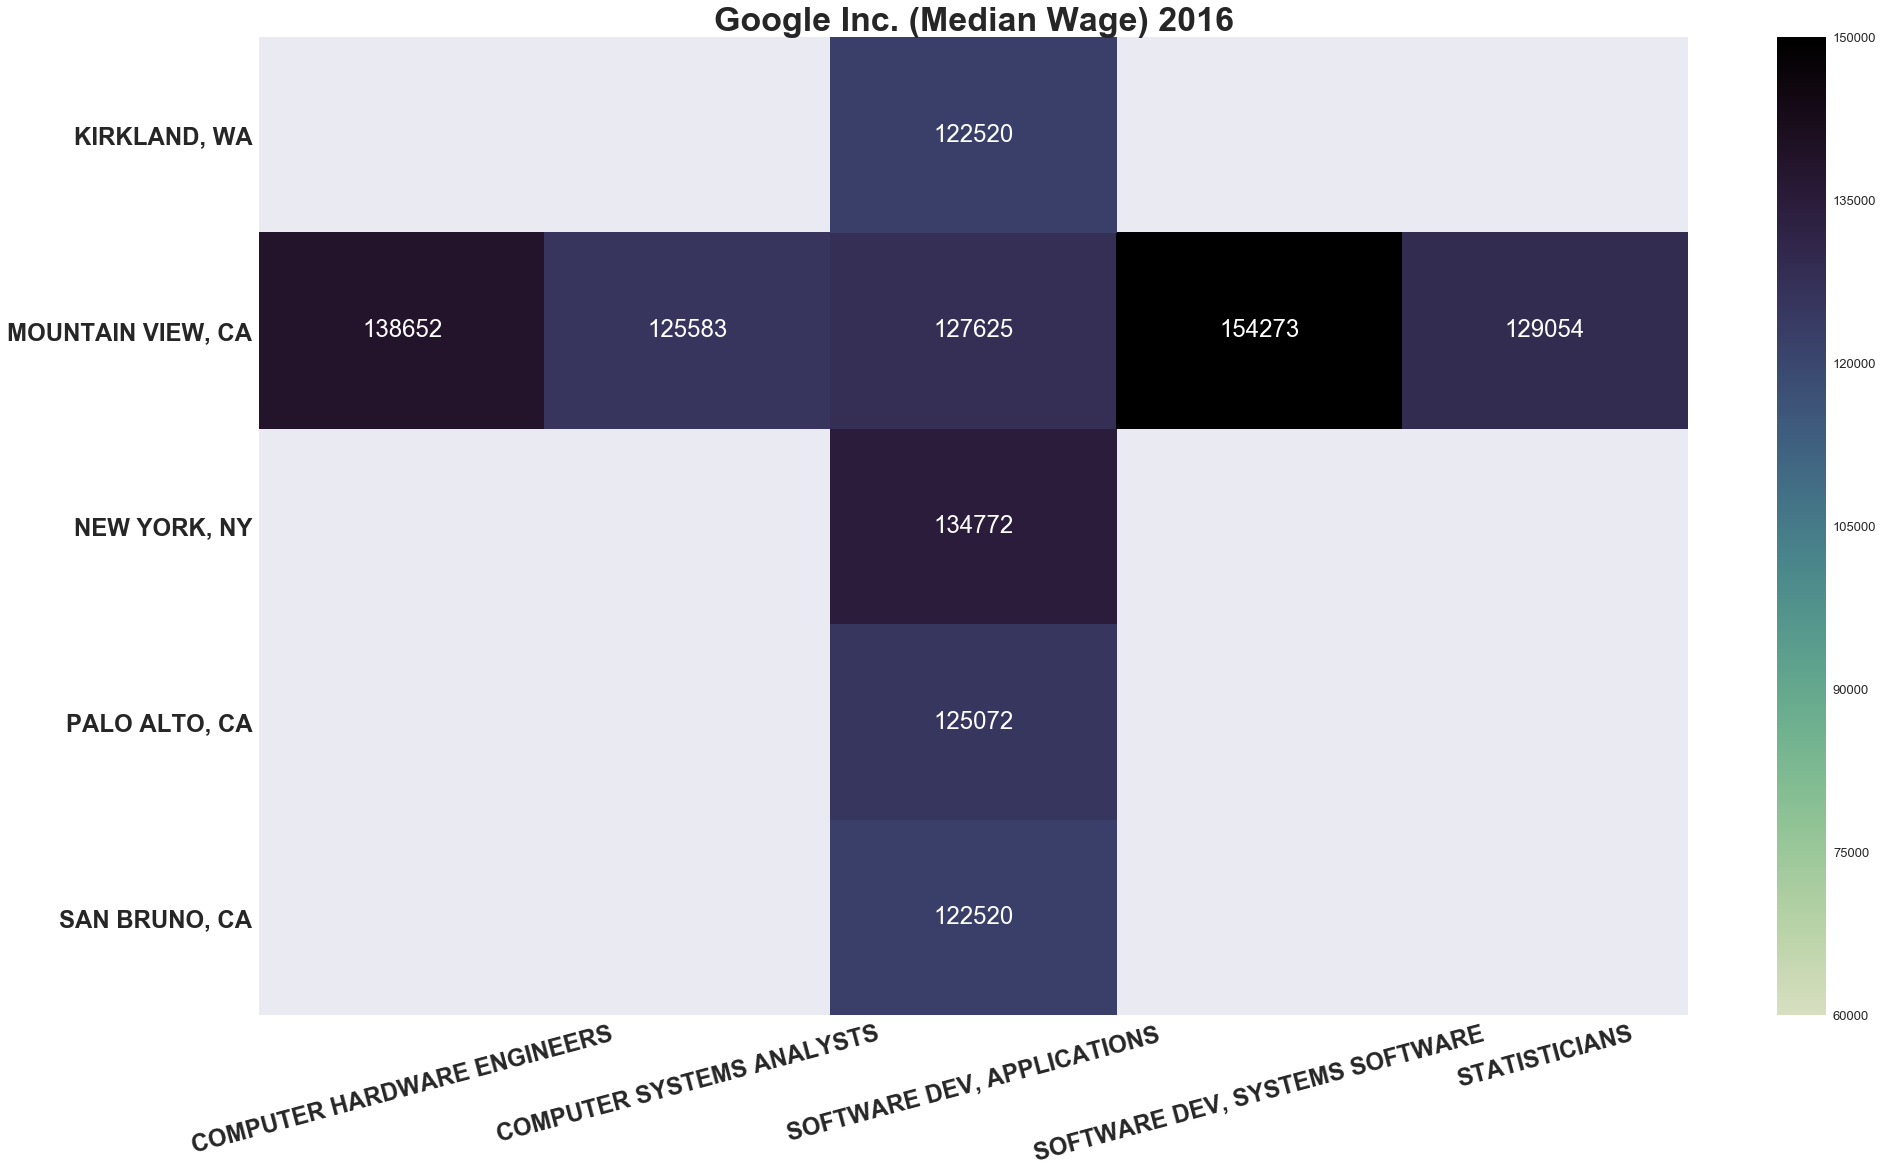
If we look at the wages for the American firms, the workers are consistently paid significantly higher.
I was certainly expecting that the top American firms would pay higher for their workers and I’m sure many readers were expecting the same. After all, many workers dream of working at many of these companies. In addition many of them are located in areas with a high cost of living. But still I did not expect just how extreme the difference would be.
Using this result, a question I have is if the amount of workers brought in is simply to fit a massive demand / shortage of supply in the United States, how can there be such a disparity in wages? The United States’ timezones (ignoring Hawaii / Alaska) vary only 3 hours so I would have assumed that some form of labor arbitrage, perhaps with telecommuting, would have removed this amount of variance.
A possible explanation I looked into was geography. Looking at the percentage difference to the market wage, we can see that it is not too different from many Indian IT firms.
However this only led to another question…
Why Do Top Indian IT Firms Apply Workers Under Such Different Positions?
The values above were calculated by looking at just 5 possible tech positions and calculating the relative percentage composition for each company.
For example, for some company A:
num_workers = [12, 14, 29, 60, 16]
percentage_values = num_workers / sum(num_workers)
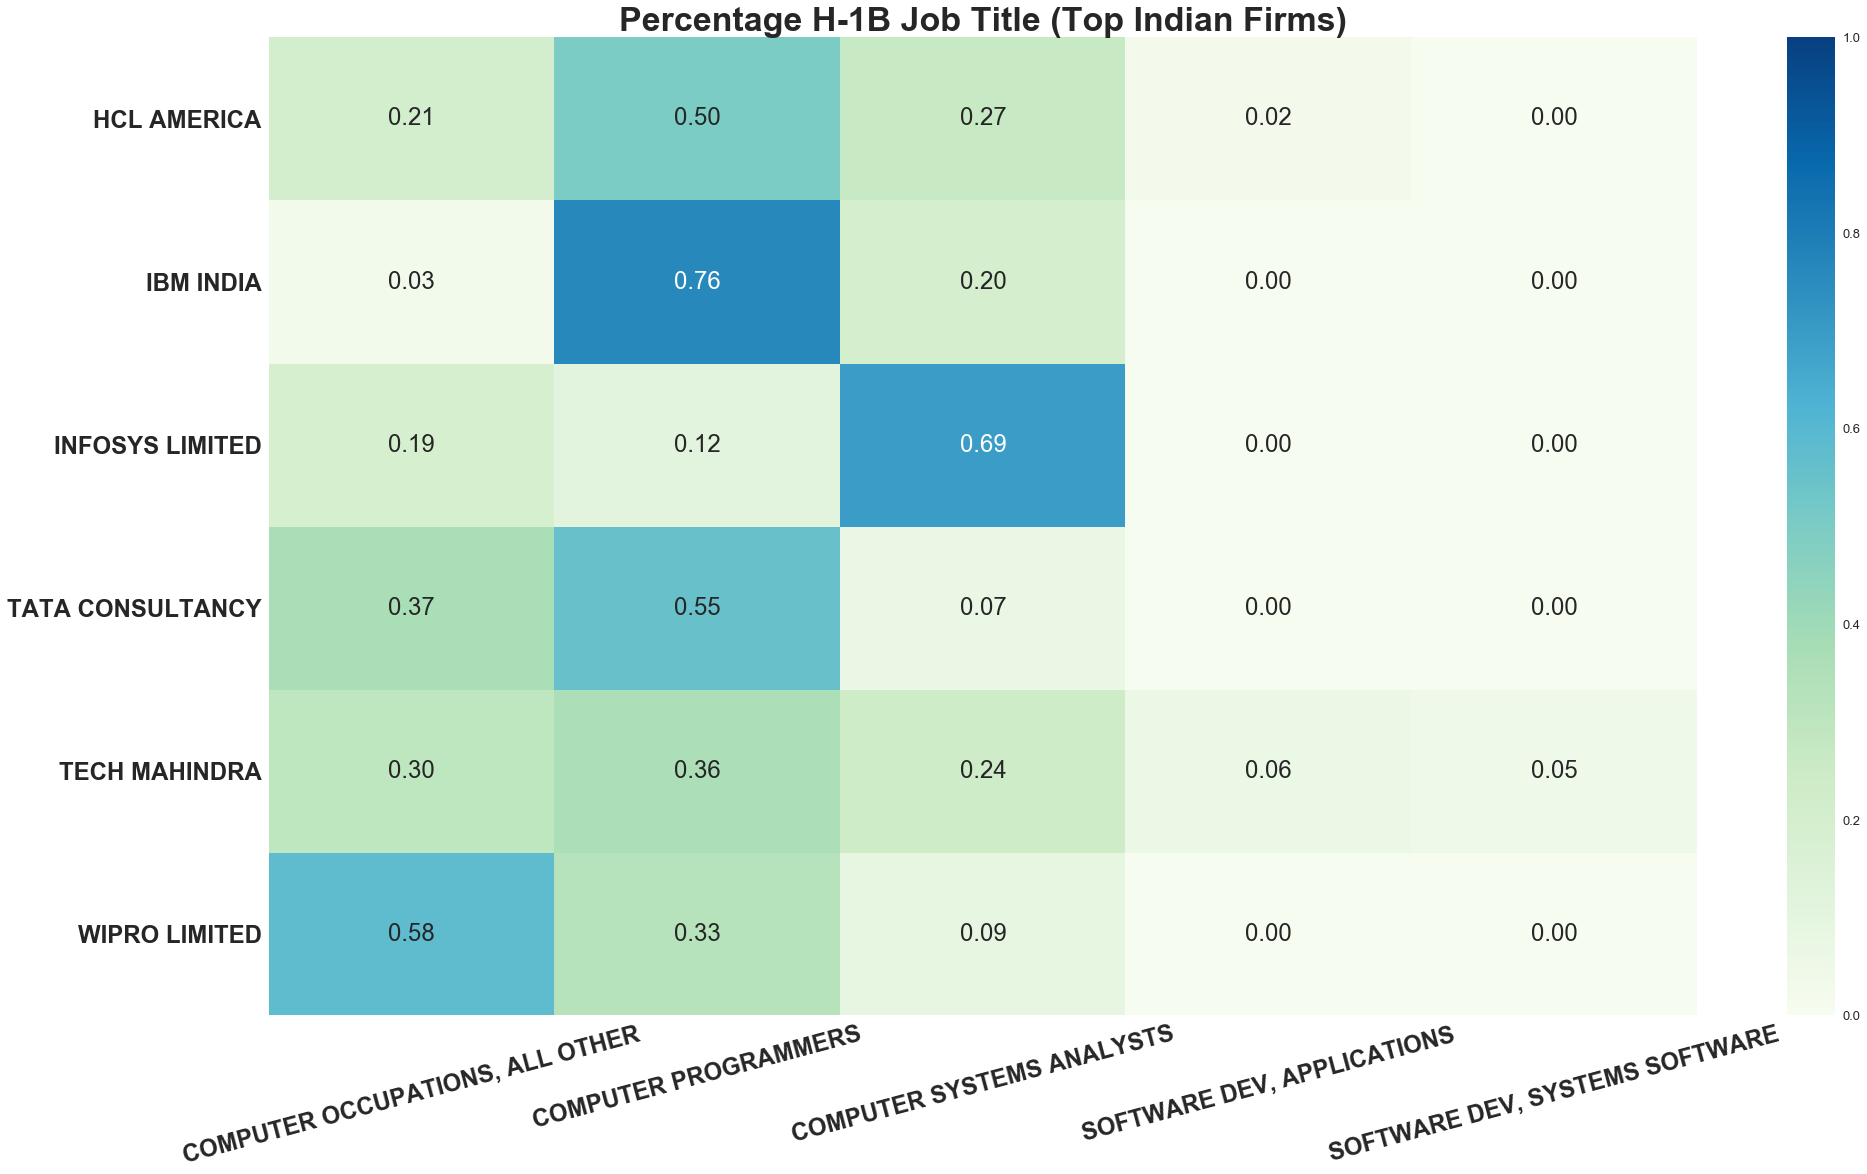
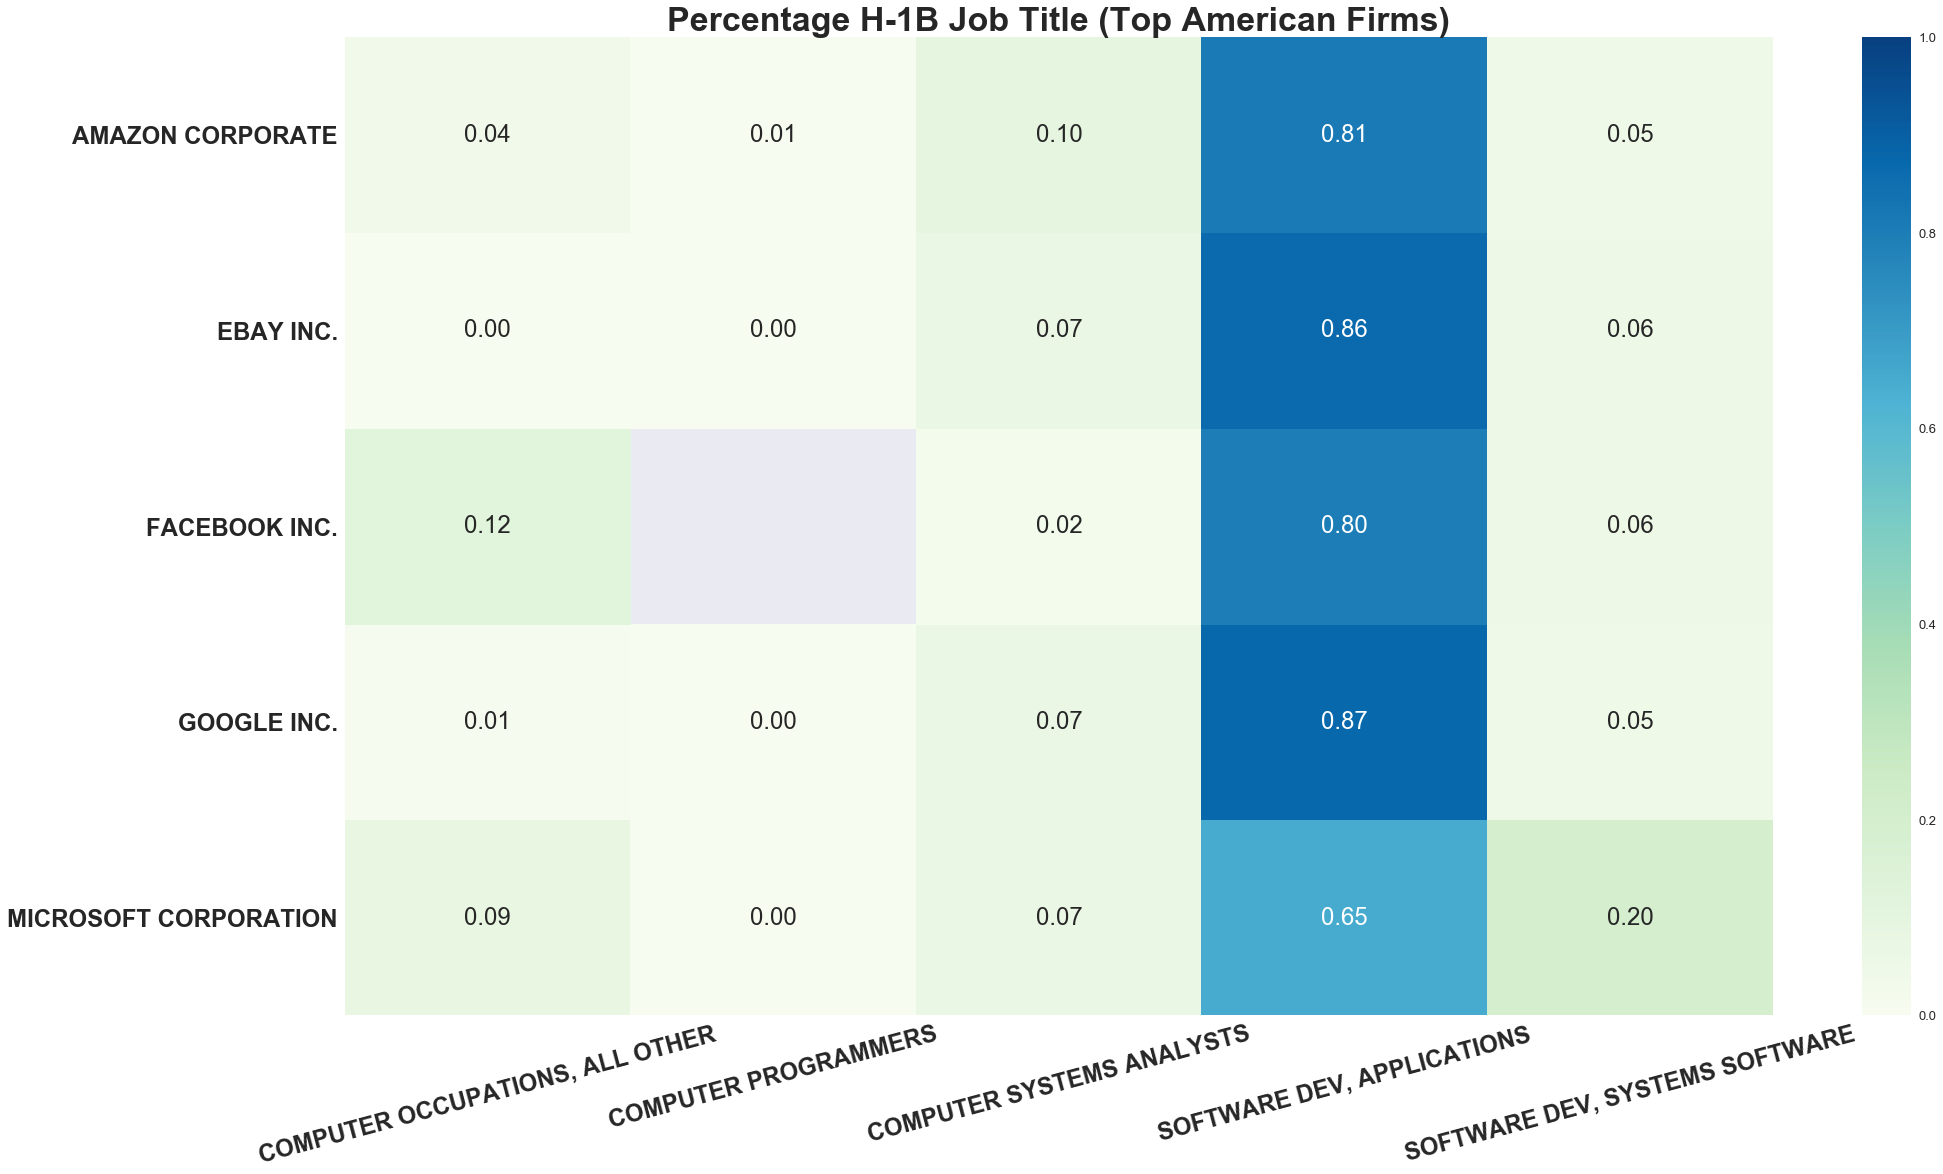
We can see that Indian IT firms exceedingly do not file their workers under software developer, but instead the workers are filed under one of several others. This is exceedingly contrary to many of the top American firms. Why is this?
What Do These Title Differences Mean?
The titles used are from the SOC codes filed with every application.
As a person in tech, the titles of computer programmer and software developer are mostly interchangeable with one another to me. To try and understand the difference, I looked into the definitions but even these seemed interchangeable with one another. I also looked at the titles used by the companies internally and it still was ambiguous, with the titles being things like “Technology Lead”, “Computer Programmer”, “Programmer Analyst” and “Developer”.
The question I have then is how are these titles determined for workers and what about it makes them disqualified to be applied as software developers in accordance to SOC?
Most Top Indian IT Firm Workers Are Paid Relatively Less Than Software Devs
For the sake of curiosity, I plotted what wages for the Indian IT companies’ workers compared to H-1B software developers in the same geo looked like.
From this it seems that many Indian IT workers outside of IBM India and Tech Mahindra are paid significantly less than those filed software devs, adding credence to there being a cause for the difference.
Take Away
In the past 8 years, the number of H-1B visa applications has grown nearly five-fold. Such growth has not gone unnoticed and has become a political top, with calls for reform abound.
In my quest to make sense of the contradicting claims on the opposing sides, I’ve learned just how tech industry dominant the visas applied for is. I’ve also learned that many Indian IT firms also started to significantly pull back starting in 2015 and continue to present day.
However I also found a peculiar difference between the types of positions that major Indian IT firms were applying for and major American IT firms were applying for. The types of positions filed for by the former in general are paid significantly less than the types of positions filed for by the latter, despite the difference in the definition of the positions being unclear (at least to me).
What exactly is the cause of this difference?
- Is it because the workers are in fact less skilled as claimed by the White House so they are filed differently?
- Is it because it allows these companies to pay the workers less for the same job because the prevailing wages for these titles are less than that of software devs?
- Or is it because of something else much more sinister or innocuous?
Unfortunately this is something I’m so far unable to conclude, but the data so far appears dubious and potentially supports the White House’s claims.
There are still TODOs so consider this a less rough draft